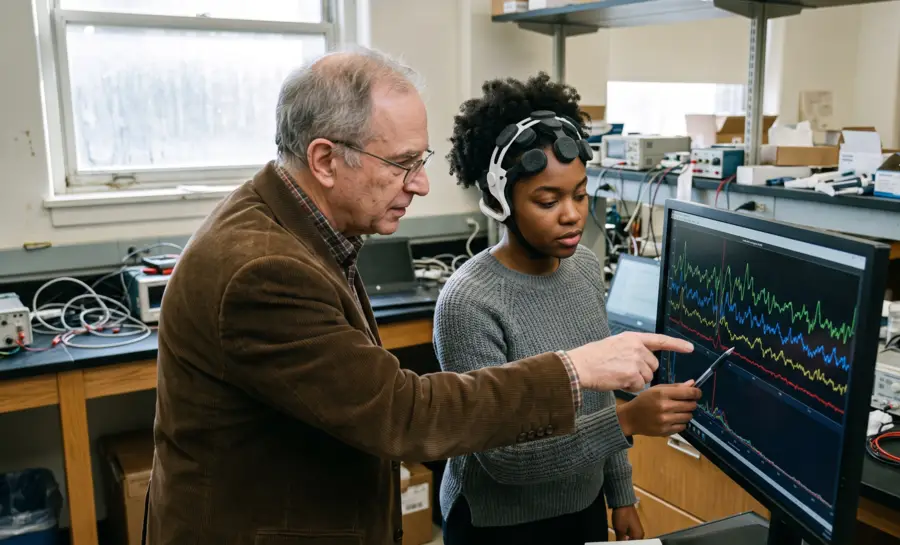
Electroencephalography (EEG) has become a cornerstone of neuroscience, providing a real-time window into the brain’s electrical activity. By placing electrodes on the scalp, researchers capture the summed electrical activity of large neuronal populations, encoded in a continuous, messy voltage trace.
To extract rhythmic signatures from this signal, scientists apply mathematical decompositions that break it down into component frequencies. This process gives rise to the familiar frequency bands—delta, theta, alpha, beta, gamma—that dominate the EEG literature.
Understanding what these bands represent, how they are generated, what they reveal about brain states, and where their clinical utility stands requires moving beyond simple labels and into the physics and physiology that underpin them.
How the EEG Signal Is Decomposed into Frequency Bands
Raw EEG records voltage fluctuations that reflect the synchronized postsynaptic potentials of millions of cortical neurons, predominantly pyramidal cells. The trace is a mixture of many overlapping rhythms and non-oscillatory aperiodic activity.
To identify the underlying oscillatory components, researchers rely on frequency analysis. The core mathematical tool is the Fourier transform, which breaks a time-varying signal into a spectrum of sine waves at different frequencies.
The squared amplitude of each sine wave represents the power at that frequency, yielding a power spectrum. This graph displays the strength of rhythmic activity as a function of frequency, from near zero hertz up to several hundred hertz.
Historically, researchers carved this continuous power spectrum into discrete, conventional ranges to simplify communication and analysis. A review of 184 resting-state EEG studies explicitly acknowledges these as “historically pre-defined frequency bands.”
The most common partitioning includes delta (0.5‑4 Hz), theta (4‑8 Hz), alpha (8‑12 Hz), beta (12‑30 Hz), and gamma (30‑100+ Hz). While these boundaries are arbitrary, they have proven instructive for characterizing brain states and comparing findings across studies.
Delta (0.5–4 Hz): Dominant in deep sleep, slow-wave rest, and certain pathological states
Theta (4–8 Hz): Associated with drowsiness, memory encoding, and spatial navigation
Alpha (8–12 Hz): Prominent during relaxed wakefulness with eyes closed; linked to reduced external attention
Beta (12–30 Hz): Reflects active concentration, motor planning, and engaging mental tasks
Gamma (30–100+ Hz): Correlates with cross-modal sensory binding, attention, and conscious processing
Importantly, the frequency landscape does not end at 0.5 Hz. Monto et al. suggested that infraslow fluctuations (0.01–0.1 Hz) are a functionally significant part of the spectrum, as shown by their research on ongoing brain activity during cognitive tasks. Thus, the classical bands represent a convenient heuristic, but they do not capture the full continuum of neural oscillations.
How Neuronal Activity Generates EEG Frequency Bands
EEG oscillations arise from rhythmic fluctuations in the membrane potentials of large ensembles of cortical neurons, especially layer 5 pyramidal cells that serve as pacemakers. When these neurons synchronously depolarize and hyperpolarize, they create coherent electrical fields detectable at the scalp. The specific frequency of oscillation is dynamically modulated by the brain’s neurotransmitter systems.
Direct cellular evidence comes from experiments that stimulated the nucleus basalis, a cluster of neurons that releases acetylcholine across the neocortex. In anesthetized animals, this stimulation transformed the cortical rhythm from large-amplitude, slow oscillations in the 1–5 Hz range to low-amplitude, fast oscillations in the 20–40 Hz range.
The shift was mediated by muscarinic acetylcholine receptors and coincided with a change in neuronal firing from a phasic, bursting pattern to a tonic, single-spike mode. This demonstrates that the brain actively toggles between frequency regimes by altering synaptic dynamics, a process central to transitions from sleep to wakeful arousal.
The organization of oscillations also shows remarkable temporal structure. Linkenkaer-Hansen et al. 2001 study suggested that amplitude fluctuations of 10 Hz and 20 Hz rhythms remain correlated over thousands of oscillation cycles, obeying power-law scaling behavior. These long-range temporal correlations and the power-law relationship are hallmarks of self-organized criticality, a state in which the brain balances on the edge between order and randomness. Such critical dynamics are thought to endow neural networks with the flexibility to reorganize rapidly in response to changing demands.
Beyond operating in isolation, frequency bands are hierarchically coupled. The phase of infraslow fluctuations (0.01–0.1 Hz) strongly modulates the amplitude of faster oscillations across six classical bands, from delta to gamma. In this way, very slow rhythms act as an excitability scaffold that gates the power of higher-frequency activity.
This cross-frequency coupling means that the brain’s oscillatory architecture is a nested, interdependent system, not a collection of independent frequency generators.
What EEG Frequency Bands Reveal About Brain Networks
When a person rests with eyes closed, spontaneous power fluctuations in different EEG bands map onto distinct, distributed cortical networks. Simultaneous EEG‑fMRI recordings have made this connection explicit.
For example, power in the alpha band (8–12 Hz) shows strong negative correlations with activity in lateral frontal and parietal cortices which are regions known to support goal-directed attention. This inverse relationship suggests that higher alpha power, commonly seen during relaxed wakefulness, may signal a state of reduced external attention or “inattention.”
In contrast, power in a 17–23 Hz beta range correlates positively with metabolism in retrosplenial, temporo‑parietal, and dorsomedial prefrontal cortices. These areas correspond to the brain’s default mode network (DMN), which is typically active when the mind is at rest, engaging in self-referential thought, memory retrieval, or mind-wandering. Beta power appears to be a signature of spontaneous cognitive operations even in the absence of an explicit task.
Thus, frequency bands serve as electrophysiological signatures that reveal whether the brain is oriented toward the external world (alpha‑related network suppression) or immersed in internal mentation (beta‑related DMN activation).
The spectral profile, therefore, offers a non‑invasive snapshot of the brain’s large‑scale functional architecture, shifting the interpretation of EEG from mere “brain waves” to dynamic indicators of network engagement.
The Diagnostic Promise and Limitations of EEG Band Analysis
The search for objective neurophysiological biomarkers has driven extensive use of frequency band analysis in psychiatric research.
The aforementioned comprehensive review of 184 resting‑state studies examined spectral differences across depression, ADHD, autism, addiction, bipolar disorder, anxiety, PTSD, OCD, schizophrenia, and others. Aggregating all reported results, the most dominant pattern was increased power in lower frequencies (delta and theta) together with decreased power in higher frequencies (alpha, beta, and gamma). This pattern emerged across multiple diagnoses, including ADHD, schizophrenia, and OCD.
Dominant pattern: Elevated delta and theta power alongside reduced alpha, beta, and gamma power
Widespread but non‑specific: Appears across ADHD, schizophrenia, and OCD, not unique to any one diagnosis
Inconsistent findings: PTSD, addiction, and autism showed no systematic spectral trend
Modest statistical strength: Likelihood of the pattern was only 2.2 times baseline; cumulative sample sizes often under 250 participants
However, this seemingly consistent finding masks significant caveats. The same pattern was not specific to any one disorder; substantial overlap was present across diagnostic categories, and several conditions (PTSD, addiction, autism) showed no systematic trend at all.
Quantitatively, the likelihood of observing this dominant pattern over alternative results was only 2.2 times, and the cumulative participant count across all studies reporting it was typically fewer than 250. Further, effect sizes were modest, typically resulting in a 20–30% change in power, and correlations with symptom severity were weak.
These findings caution against interpreting band‑power differences as reliable biomarkers for individual diagnosis. Methodological inconsistencies—including varying electrode montages, reference schemes, and artifact handling—further limit replicability.
While frequency band analysis can reveal group‑level tendencies, its clinical utility in its current form is modest, and the bands themselves do not constitute disease‑specific signatures.
Seeing the Whole Spectrum Beyond EEG Frequency Band Labels
The five classic frequency bands are a practical shorthand, not a map of discrete biological switches. The brain's electrical activity is a continuous, overlapping stream in which slow rhythms steer faster ones and neurotransmitter systems shift the entire regime from sleep to alert focus.
Recognizing this nested, power-law structure reframes EEG from a simple chart of “brain waves” into a window on the brain's dynamic, self-organizing balance between order and flexibility.
For practical use, the value of these bands lies in describing broad states such as relaxed wakefulness, internal thought, or attention—patterns that show up strongly at the group level. Yet the clinical evidence is clear that band-power differences can be modest, nonspecific, and heavily influenced by methodology, so they must not be overread as individual diagnoses.
The responsible takeaway is that these labels offer a useful vocabulary for exploring brain states, as long as one remembers the underlying reality is a single, integrated spectrum.
References
Newson, J. J., & Thiagarajan, T. C. (2019). EEG frequency bands in psychiatric disorders: a review of resting state studies. Frontiers in human neuroscience, 12, 521. https://doi.org/10.3389/fnhum.2018.00521
Monto, S., Palva, S., Voipio, J., & Palva, J. M. (2008). Very slow EEG fluctuations predict the dynamics of stimulus detection and oscillation amplitudes in humans. Journal of Neuroscience, 28(33), 8268-8272. https://doi.org/10.1523/JNEUROSCI.1910-08.2008
Metherate, R., Cox, C. L., & Ashe, J. H. (1992). Cellular bases of neocortical activation: modulation of neural oscillations by the nucleus basalis and endogenous acetylcholine. The Journal of Neuroscience, 12(12), 4701-4711. https://doi.org/10.1523/JNEUROSCI.12-12-04701.1992
Linkenkaer-Hansen, K., Nikouline, V. V., Palva, J. M., & Ilmoniemi, R. J. (2001). Long-range temporal correlations and scaling behavior in human brain oscillations. The Journal of neuroscience, 21(4), 1370-1377. https://doi.org/10.1523/JNEUROSCI.21-04-01370.2001
Laufs, H., Krakow, K., Sterzer, P., Eger, E., Beyerle, A., Salek-Haddadi, A., & Kleinschmidt, A. D. (2003). Electroencephalographic signatures of attentional and cognitive default modes in spontaneous brain activity fluctuations at rest. Proceedings of the national academy of sciences, 100(19), 11053-11058. https://doi.org/10.1073/pnas.1831638100
Frequently Asked Questions
What are EEG frequency bands, and how are they defined?
EEG frequency bands are conventional subdivisions of the continuous brain wave spectrum, typically named delta, theta, alpha, beta, and gamma. They are defined by using a mathematical tool called the Fourier transform to break the raw EEG signal into component sine waves and then grouping the power at different frequencies into historically established ranges. These boundaries are a convenient heuristic for communication and analysis, not reflections of discrete biological categories.
How does the brain actually produce these different frequency rhythms?
The rhythms arise from synchronized electrical activity in large groups of cortical neurons, especially layer 5 pyramidal cells, which act as pacemakers. When these neurons depolarize and hyperpolarize together, they create an electrical field detectable at the scalp. Neurotransmitter systems, such as acetylcholine, dynamically shift the frequency regime by changing how these neurons fire, toggling between slow, bursting activity and fast, single-spike patterns.
What does alpha band activity tell us about a person's brain state?
Alpha power, especially when a person rests with eyes closed, is inversely related to activity in brain regions that support goal-directed attention. This means higher alpha power is typically a sign of relaxed wakefulness and reduced external attention. In contrast, lower alpha power is associated with engaging with the external world.
What is the relationship between beta band activity and the default mode network?
Beta power in a roughly 17–23 Hz range correlates positively with activity in the default mode network, a set of brain regions active during rest and self-referential thought. This suggests that beta oscillations are an electrophysiological signature of spontaneous internal mental activity, such as mind-wandering and memory retrieval, even when no explicit task is being performed. Therefore, beta power can reveal whether the brain is internally absorbed rather than externally oriented.
What is cross-frequency coupling in the brain?
Cross-frequency coupling is the phenomenon where the phase of very slow oscillations modulates the amplitude of faster oscillations across many frequency bands. This means slow rhythms act like an excitability scaffold, gating the power of higher-frequency activity. It shows that EEG rhythms are not independent generators but rather a nested, interdependent system.
Does the EEG spectrum contain activity beyond the standard five bands?
Yes, the spectrum extends below delta, with infraslow fluctuations in the 0.01–0.1 Hz range that are functionally significant. These very slow rhythms modulate the amplitude of faster oscillations, including all classical bands. The standard bands are therefore a useful abstraction, but the brain's electrical activity is best understood as a continuous, integrated spectrum.
Emotiv is a neurotechnology leader helping advance neuroscience research through accessible EEG and brain data tools.
Medical Disclaimer: The information provided on this website is for educational and informational purposes only and is not intended as medical or health advice. This content may contain errors and should not be relied upon to make life-altering health, medical, or lifestyle choices. Always seek the advice of your physician or other qualified health provider with any questions you may have regarding a medical condition or treatment.
Christian Burgos